-
News & Trends -
Sales -
Marketing Related Topics -
B2B Software Guides Related Topics -
Free Tools & Resources -
- About Us About Us
Forecasting revenue is essential for B2B teams. With longer sales cycles, multiple buyer interactions, and changing market conditions, sales and marketing professionals need structured tools to predict outcomes, coordinate teams, and reassure leadership. That’s where a sales forecast template comes in handy.
In this guide, you’ll get:
Regardless of your role — VP of Sales, RevOps leader, or marketing director — these projected sales forecast templates will provide you with actionable insights to implement each year.
According to Xactly’s 2024 Sales Forecasting Benchmark Report, 98% of sales leaders struggle to build accurate forecasts, and 90% say better tools would dramatically improve forecasting accuracy and detail. In other words, most teams don’t have the structured systems or models needed to forecast confidently.
To help solve this, I created a B2B Sales Forecasting Template Bundle designed specifically for sales, marketing, and RevOps teams that need a clear, reliable way to project revenue throughout the year.
Each template works on its own, but the real value comes from using them together to produce a holistic forecast across leads, pipeline, accounts, and marketing channels.
This bundle includes:
These templates are built in Google Sheets, but you can use them in Excel or any spreadsheet tool. Just make a copy (File → Make a Copy) and customize it to match your team, your goals, and your 2026 revenue targets.
Once you’ve downloaded the bundle, continue reading this guide to learn exactly how to use each of the five templates in your B2B forecasting process.
Before diving into the step-by-step forecasting process, it’s helpful to understand what each template in the bundle is designed to do.
The five templates below cover every major forecasting angle, including leads, pipeline, accounts, time periods, and marketing attribution, so you can build a complete and accurate view of expected revenue for the year.
| Template | Why B2B teams need it | Best for |
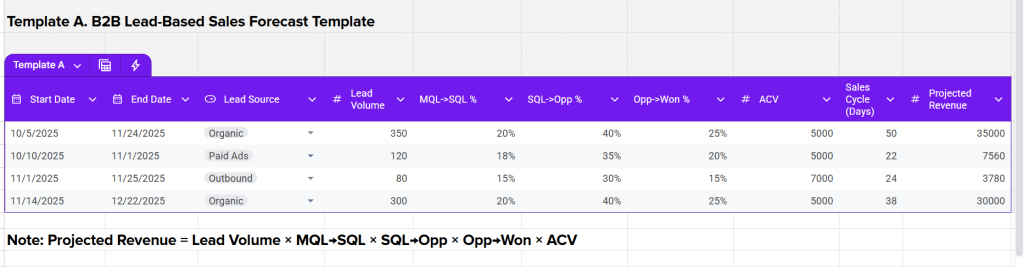
| A. B2B lead-based sales forecast template | • Shows a direct connection between marketing qualified leads (MQLs) and sales revenue • Helps teams plan content, campaigns, and SDR outreach • Ideal “top-of-funnel to revenue” visualization | • Marketing-led teams • Demand generation • Sales development reps (SDRs) |
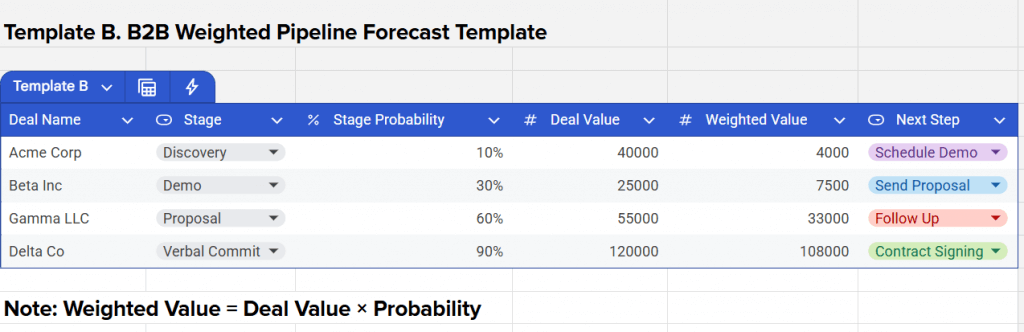
| B. Weighted pipeline forecast template | • Provides a realistic weighted revenue forecast • Helps sales leaders evaluate quarter-end attainment • Useful for long or complex B2B sales cycles | • Sales teams with active pipelines • Account executives • SDRs • RevOps |
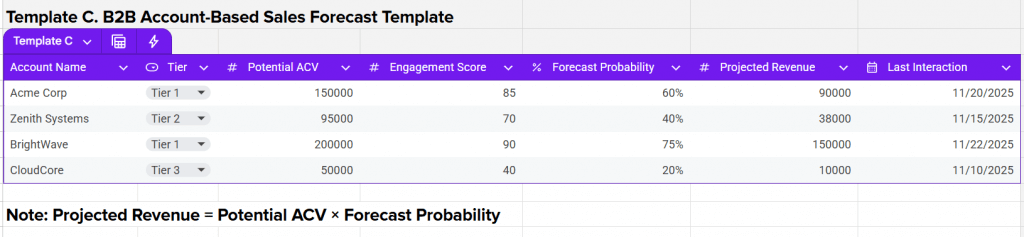
| C. Account-based sales forecast template | • Forecasts revenue from high-value accounts • Helps ABM teams align marketing and sales plays • Ideal for enterprise teams with fewer, larger deals | • Account-based management (ABM) teams • Enterprise sales • Account executives |
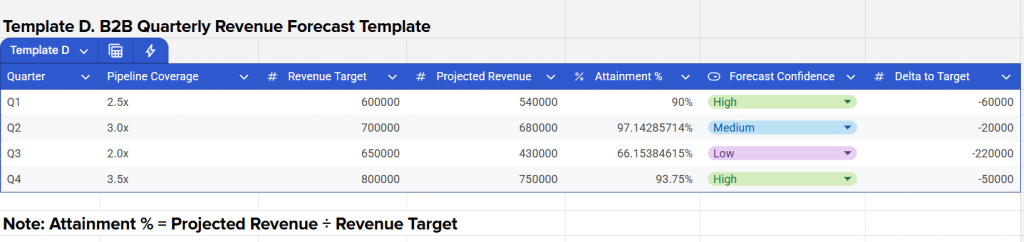
| D. Quarterly revenue forecast template | • Applies to board-level discussions and strategic planning • Offers a macro view across the year • Helps teams set quarterly pipeline targets | • Leadership reporting • Board decks • RevOps planning |
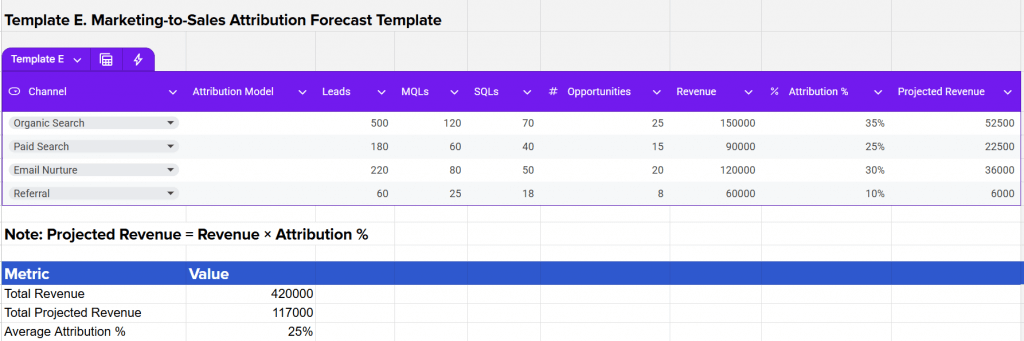
| E. Marketing-to-sales attribution forecast template | • Helps marketing teams forecast revenue impact by channel • Supports cross-functional planning and budget allocation • Useful for omnichannel campaigns | • Marketing teams working on full-funnel forecasting |
This template helps B2B teams estimate future revenue by connecting lead volume to sales outcomes. Simply enter your expected leads per channel, conversion rates, sales cycle length, and average contract value (ACV).
The template automatically projects monthly and quarterly revenue totals. This makes it ideal for demand-gen-driven organizations where marketing contributes a significant portion of the pipeline.
Primary use: Top-of-funnel → revenue forecasting
Perfect for sales teams managing active pipelines, this template calculates weighted revenue based on opportunity stage probabilities. Just input deal values and stage, and the sheet automatically generates weighted revenue projections.
This model is beneficial for long B2B cycles, where forecasting confidence increases as deals progress through the pipeline.
Primary use: Stage-based forecasting for active opportunities
Built for ABM and enterprise teams, this template organizes revenue projections by account. You can customize the template by assigning account tiers, tracking engagement scores, setting forecast probabilities, and calculating potential ACV. It’s perfect for organizations focused on landing fewer, higher-value accounts.
Primary use: Account-level revenue projections
This high-level forecasting template provides a leadership-friendly view of quarterly revenue expectations.
It includes fields for pipeline coverage, revenue targets, attainment percentages, stage progression, and forecast confidence levels. It’s also excellent for board decks and quarterly business reviews.
Primary use: Strategic quarterly planning and reporting
This template forecasts revenue by channel using attribution models like first-touch, last-touch, and multi-touch.
By linking leads, MQLs, SQLs, opportunities, and revenue to specific channels, B2B teams can identify which marketing initiatives drive the pipeline most and predict future output more accurately.
Primary use: Channel-specific revenue forecasting based on attribution
Once you have downloaded your sales forecast template bundle, use the five templates together to build a complete, multi-layered B2B revenue forecast.
Each template covers a different part of the sales engine, shifting from lead generation to pipeline health, account strategy, and marketing attribution. So, I broke down the instructions for each template to give you a full, accurate view of projected revenue for 2026.
Step 1: Start with the lead-based forecasting model (top-of-funnel projection)
Template used: Lead-based forecasting model built for B2B
Step 2: Add the weighted-pipeline model (bottom-up projection)
Template used: Weighted-pipeline model for opportunities already in motion
Step 3: Layer in account-based forecasting (strategic revenue outlook)
Template used: Account-based sales forecast model for target accounts and ABM programs
Step 4: Build executive-level visibility with quarterly and annual summary dashboards
Template used: Quarterly and yearly forecasting sheets and dashboard visualizations
Step 5: Build monthly and quarterly forecasts
Template used: Marketing-to-sales attribution forecast model by channel and touchpoint
Step 6: Finalize, align, and update your forecast
Once all templates are in place:
To effectively use a B2B sales forecast template, it’s crucial to tailor it to your specific business context.
Below are a few scenarios that illustrate how different organizations can adapt this forecasting tool to meet their specific needs.
Marketing-led demand generation teams can use the lead-based forecasting template to connect top-of-funnel activity directly to revenue.
By entering projected lead volume, channel-specific conversion rates, and ACV, these teams can quickly see how marketing efforts influence pipeline creation and quarterly revenue targets. This helps organizations refine campaign strategies, allocate budget more effectively, and adjust their funnel targets based on performance trends.
While there are many benefits to using a sales forecast template, the following list includes an overview of why the templates above are most beneficial for B2B sales and marketing professionals.
Choose a sales forecast template based on your sales cycle, data availability, and forecasting model. B2B teams often benefit most from templates that track lead stages, conversion rates, and projected revenue across long sales cycles.
Most B2B teams update their sales forecast template weekly or monthly to reflect new pipeline activity, closed deals, and shifting market conditions.
Yes. Marketing should contribute to sales forecasting because their data, including lead volume, lead quality, campaign performance, and conversion rates, directly affects revenue projections. When marketing aligns with sales, the sales forecast template becomes more accurate and reflects the full demand-generation pipeline.
In 2026 and beyond, B2B teams that rely on guesswork will fall behind those who forecast with data, structure, and alignment.
By downloading the B2B Sales Forecast Template Bundle, customizing the lead-sales projection format, and following the step-by-step walk-through above, you’ll give your team the tools to project revenue confidently, drive cross-team alignment, and respond quickly to shifts in pipeline dynamics.
Ready to get started? Download the pack, adapt the template, and make 2026 your most predictable year yet.

Selling Signals delivers actionable advice for sales and marketing professionals. Learn strategies that help you hit targets, strengthen customer relationships, and win more business. Get expert advice on lead generation, sales processes, CRM software, sales management, and account management directly to your inbox.
Property of TechnologyAdvice. © 2026 TechnologyAdvice. All Rights Reserved
Advertiser Disclosure: Some of the products that appear on this site are from companies from which TechnologyAdvice receives compensation. This compensation may impact how and where products appear on this site including, for example, the order in which they appear. TechnologyAdvice does not include all companies or all types of products available in the marketplace.