-
News & Trends -
Sales -
Marketing Related Topics -
B2B Software Guides Related Topics -
Free Tools & Resources -
- About Us About Us
Customer relationship management (CRM) metrics are the performance signals sales teams use to understand what’s really happening in the pipeline. This includes what’s working, what’s stalling, and where revenue is at risk.
These data points help sales leaders and reps make smarter decisions by turning daily activity into clear, measurable outcomes.
In my experience, the challenge isn’t collecting customer relationship management metrics; it’s choosing the ones that actually drive action. I’ve seen teams track dozens of numbers that look impressive on a dashboard but don’t improve performance. But the most effective CRM reporting focuses on a small set of metrics that reveal execution, customer health, and growth potential.
In this guide, I’ll break down the top five CRM metrics sales teams should track, including how to calculate each one and how to build a simple dashboard in HubSpot CRM that turns insights into decisions.
CRM metrics are quantifiable measures that show how your sales process is performing, from lead conversion to customer retention. They give sales teams a shared language to evaluate performance, identify problems early, and improve decision-making.
But CRM performance metrics aren’t just a reporting exercise. The best teams use them to answer core questions like:
CRM metrics vs CRM KPIs
You’ll often see “CRM metrics” and “KPIs” used interchangeably, but there’s a difference in context. CRM metrics are measurements you can track in your CRM system, such as win rate, retention, and churn.
KPIs, on the other hand, are the metrics your business prioritizes as indicators of success. A metric becomes a KPI when leadership decides it should drive goals, coaching, or strategy.
If your CRM dashboard doesn’t help you decide in under 30 seconds, you’re tracking too much. Your dashboard should quickly answer the following questions:
There are five CRM key performance indicators that all sales teams should incorporate into their CRM dashboards and reports to track sales performance and long-term growth.
I selected these metrics because, while every business has its own objectives and interpretations of success, they’re often built around the pillars of sales growth, customer satisfaction, and internal performance — all of which these metrics touch upon.
They’ll also serve as a foundation on which other relevant CRM metrics can be added.
| What it reveals | Who owns it | Review cadence | |
| Close rate (win rate) | Pipeline efficiency | Sales leaderRevOps | Weekly |
| Customer retention rate | Customer durability | Customer successRevOps | Monthly |
| Churn rate | Revenue risk | Customer successLeadership | Monthly |
| Net Promoter Score (NPS) | Customer sentiment | Customer serviceProduct management | Quarterly |
| Quota attainment | Rep execution | Sales leaderSales ops | Weekly |
Who should track this metric: Sales and marketing teams that want to measure the percentage of leads that convert into customers.
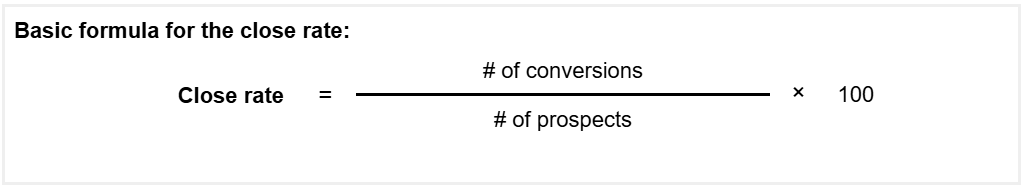
Close rate measures the percentage of prospects that converted into customers. This is an important metric for salespeople to track and see how they are individually performing, but it’s also good for sales managers to track overall performance.
It's also an important metric for marketers to ensure the leads they’re generating are high quality.
This formula can also be adapted to any marketing channel. For instance, when tracking a close rate for an email campaign, the “prospects” in this case would be the total number of emails sent.
Meanwhile, figuring out the close rate for a landing page would involve dividing total conversions by the number of site visitors.
Suppose your sales team conducted 350 sales calls to potential customers within a month, which resulted in 70 successful sales conversions.
To determine the close rate for this sales team, you’d need to divide the number of closed deals (70) by the total number of sales calls made (350) and then multiply that by 100 to get a percentage.
For this example, the computation would be:
Close rate = (70/350) x 100 = 20%
Therefore, with each 100 sales calls made, your sales team was able to close approximately 20 deals.
There is no universal standard when it comes to determining an ideal close (aka conversion) rate, as average conversion rates vary among industries and marketing channels.
Who should track this metric: Client-facing teams that want quantifiable evidence of customer loyalty over a period of time.
Customer retention rate measures how effective a business is at keeping customers. It highlights the likelihood of someone returning to buy additional goods or services.
Following this metric can benefit a business’s bottom line, considering the rising costs of customer acquisition. Client-facing teams like sales or support should track the customer retention rate to understand how invested customers are in a business.
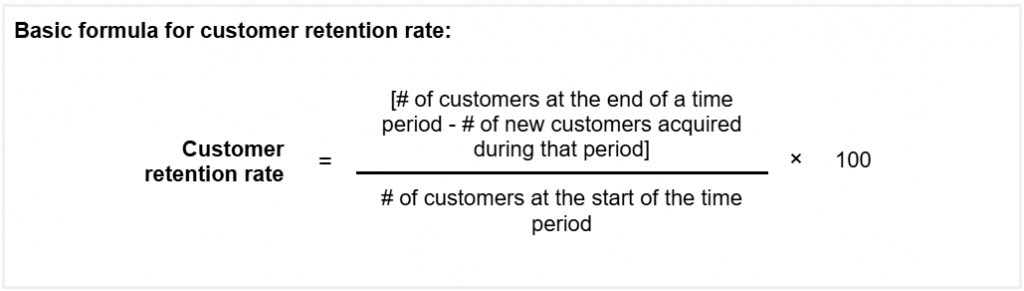
Let's assume that your business started the year off with 1,000 customers and throughout the year, it gained an additional 150 new customers. By the end of the year, you had a total of 1,050 customers, including those lost and gained.
To calculate the retention rate of your business, determine the percentage of customers retained from the beginning of the year.
Using the following values, let's determine the CRR:
Number of customers at the end of the period = 1,050
Number of new customers acquired = 150
Number of customers at the start of the period = 1,000
CRR = (/1,000) x 100
CRR = (900/1,000) x 100
CRR = 90%
Therefore, your retail business managed to retain 90% of its customers throughout the year.
Before calculating the CRR, have a time period in place (weekly, monthly, quarterly, or yearly). Subtracting the total customer retention rate from 100 will reveal the percentage of customers lost, or churn rate.
However, it’s important for businesses to track churn rate independently because it complements the CRR by providing insight into when and why a business is losing customers.
Who should track this metric: Sales teams that want a clearer understanding of why overall growth is stagnating.
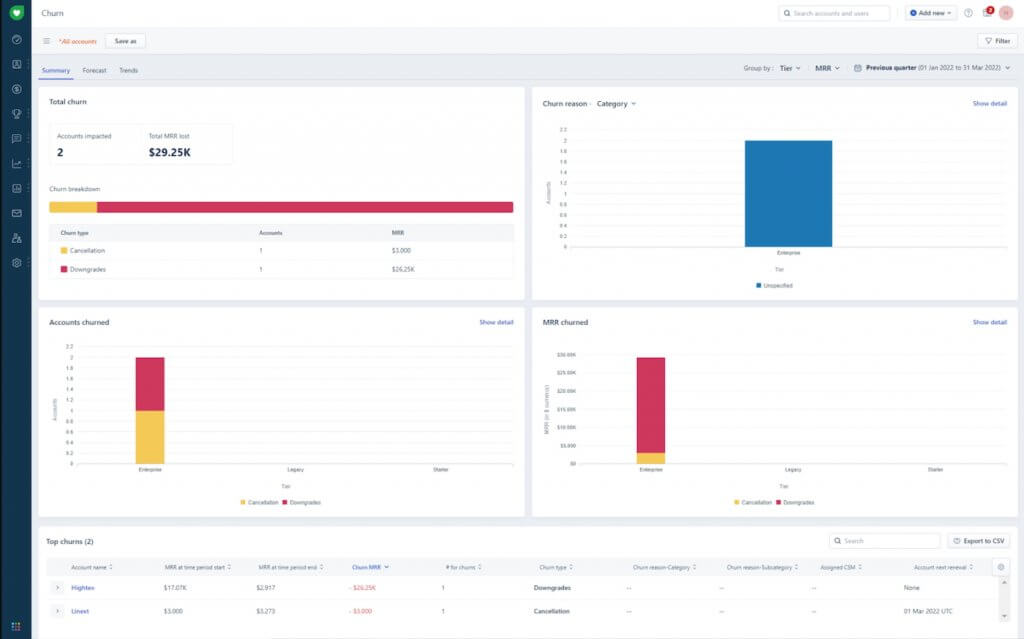
Churn rate measures the number of customers who no longer buy from a business. Customer churn is inevitable for any business, but high churn can negatively impact a business’s profit margin and overall growth.
Plus, high churn can inspire businesses to investigate other potential issues like poor customer satisfaction and ineffective marketing initiatives. Regularly tracking churn rate will aid sales teams in identifying and fixing related trends before it’s too late.
Let’s say your business offers a subscription-based service and you want to determine the churn rate for the month of April.
Your business has 3,000 subscribers at the start of April, but you end up losing 120 customers by the end of the month.
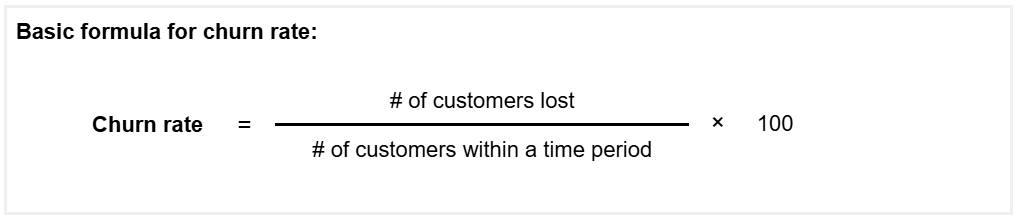
To determine the churn rate, divide the number of lost customers (120) by the total number of subscribers you had at the beginning of the month (3,000), and multiply it by 100.
The result will be:
Churn rate = (120/3,000) x 100
Churn rate = 4%
The churn rate reveals that 4% of your subscribers terminated their subscriptions.
Like customer retention rate, a specific time frame should be in place when calculating churn rate. While calculating churn rate alone won’t shed light on the reason for customer attrition, it can motivate businesses to take a look at their Net Promoter Score (NPS) for possible indicators of dissatisfaction.
We’ll take a look at how to calculate the NPS in the next section.
Who should track this metric: Reps who want to leverage positive and negative customer feedback to increase sales.
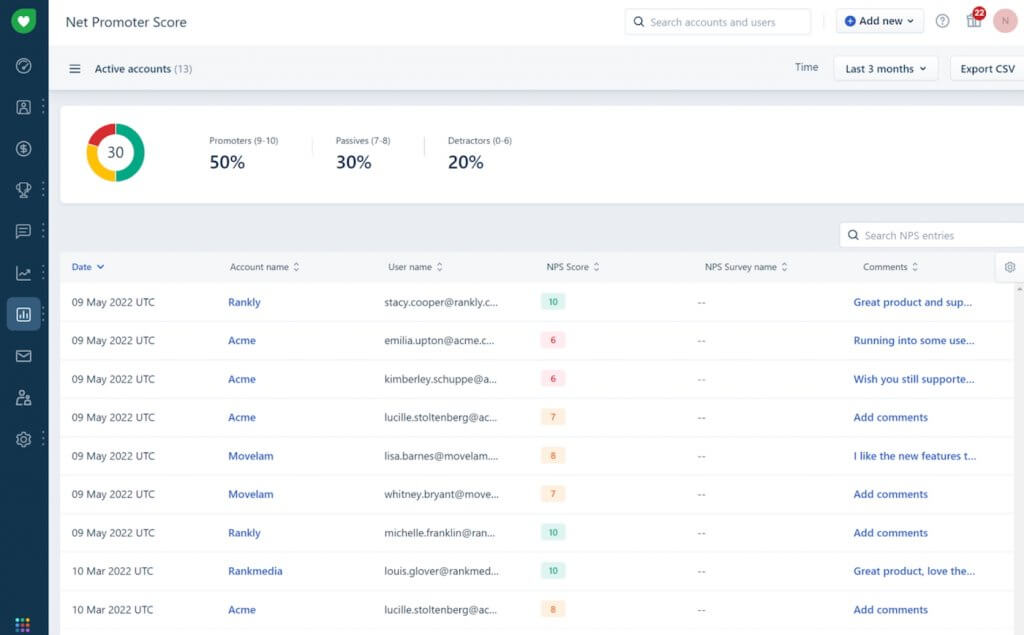
Net promoter score measures a customer’s willingness to recommend a product or service. This data is collected via an online survey that’s administered after a purchase or query.
NPS classifies respondents as promoters, passives, and detractors. Sales reps can use NPS data to identify promoters and leverage their loyalty to increase cross-sales, and to find potential churns (passives and detractors) so they can reach out and salvage the relationship.
NPS data is generated from the results of a net promoter survey. There are several ways to approach this, but the main theme is to ask a straightforward question and receive a customer rating in return.
Survey respondents are categorized as promoters, passives, and detractors.
NPS is a global benchmark. So, while ideal scores will vary among industries, the global average NPS is +32.
A total of 200 customers participated in the survey, with 62% of them considered promoters, 21% passives, and 16.5% detractors. To compute the company’s NPS, subtract the percentage of detractors (16.5) from the percentage of promoters (62.5), which results in an NPS of 46.
Who should track this metric: Sales managers who want to evaluate team performance and tailor expectations.
Quota attainment measures how close individual sales reps are to hitting a defined target or goal. It pinpoints a sales team’s top performers and weak links. However, if this number is consistently low, it may indicate unrealistic expectations or a lack of proper training.
Quota attainment should be tracked by sales managers to provide meaningful feedback during one-on-one sessions, identify necessary team structure changes, and generate tenable revenue forecasts.
Quota attainment can be measured monthly, quarterly, or yearly. Generally speaking, if 80% of a sales team is hitting their targets most of the time, that’s indicative of a realistic quota. Anything less may signal unrealistic expectations, inexperienced staff, and/or an organizational problem.
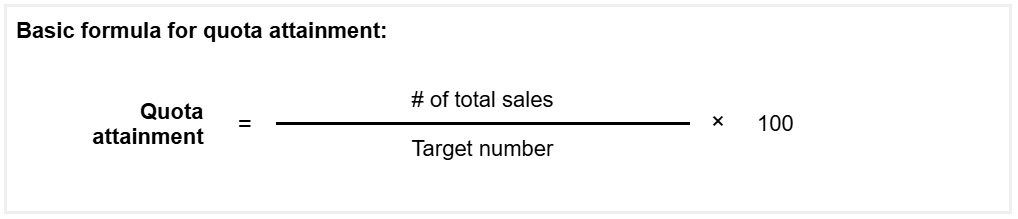
Let's assume you’re a sales manager and want to determine the quota attainment of one of your sales reps for the previous month. Your sales rep's target number was $80,000, and their total sales for last month were $85,000. To calculate the quota attainment, divide the total sales achieved by the target number and multiply by 100. The result would look like this: Quota attainment = ($85,000/$80,000) x 100 = 106.25% Therefore, your sales rep exceeded their target number by 6.25%.
Now that you know the top CRM metrics, let’s discuss how to measure CRM success. The process is similar across most platforms, but menu names and report builders can vary.
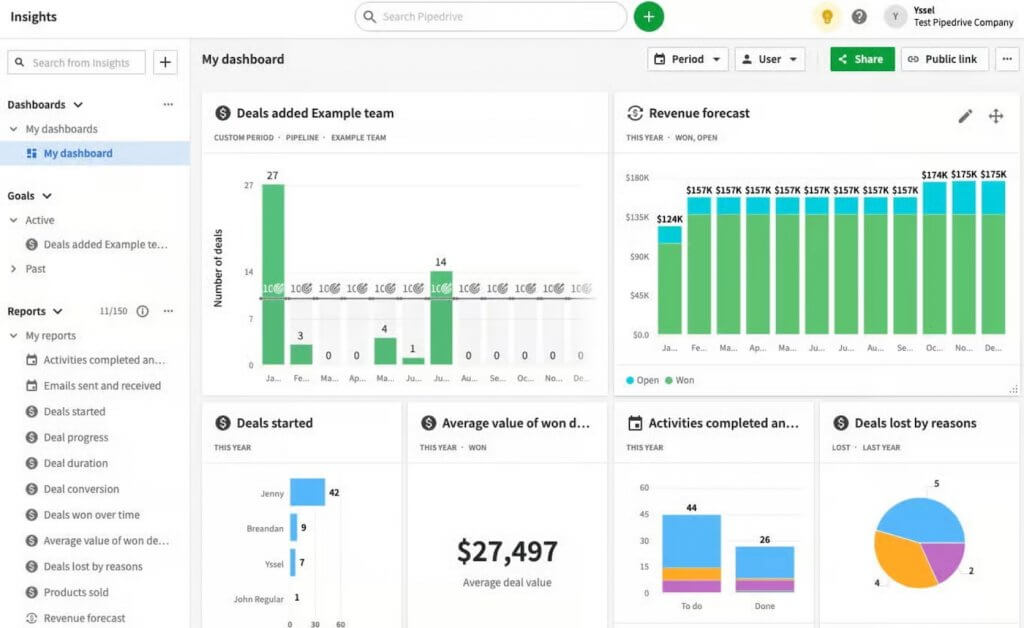
To make this easier to follow, I’ve included examples from HubSpot CRM, which offers customizable reporting and dashboard tools that help sales teams stay on top of key metrics.
To track the metrics that matter most, start by choosing what you want to monitor, then select a standard report template that matches your goal. From there, you can refine the report (when available) and add it to a dashboard for easy access and ongoing visibility.
When to use HubSpot CRM’s report library vs custom report builder
Use the report library if you want ready-made templates for common sales metrics. Use the custom report builder when you need more flexibility, like combining multiple data sources, creating more specific filters, or building a report that isn’t available as a template.
First, decide which CRM metrics you want to track. Start small, then expand as your team builds the habit of reviewing performance. Think about:
Once you’ve chosen your metrics, note the data points you’ll need (e.g., close rate typically depends on deal outcomes and time range).
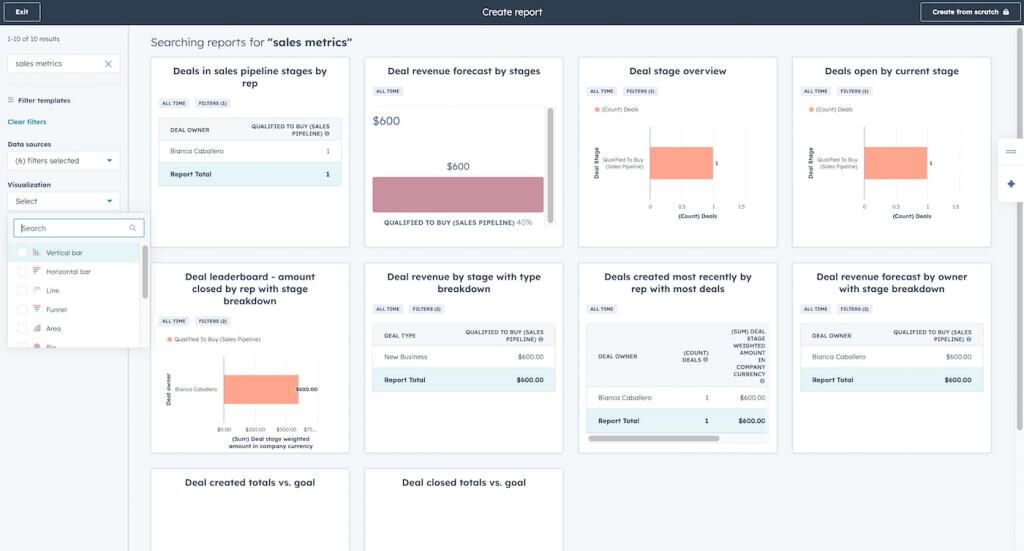
In HubSpot, go to Reporting > Reports, then click Create report. In the “Create reports from templates” section, browse HubSpot’s standard report templates for sales metrics.
To find the best match quickly:
When you find a report you want:
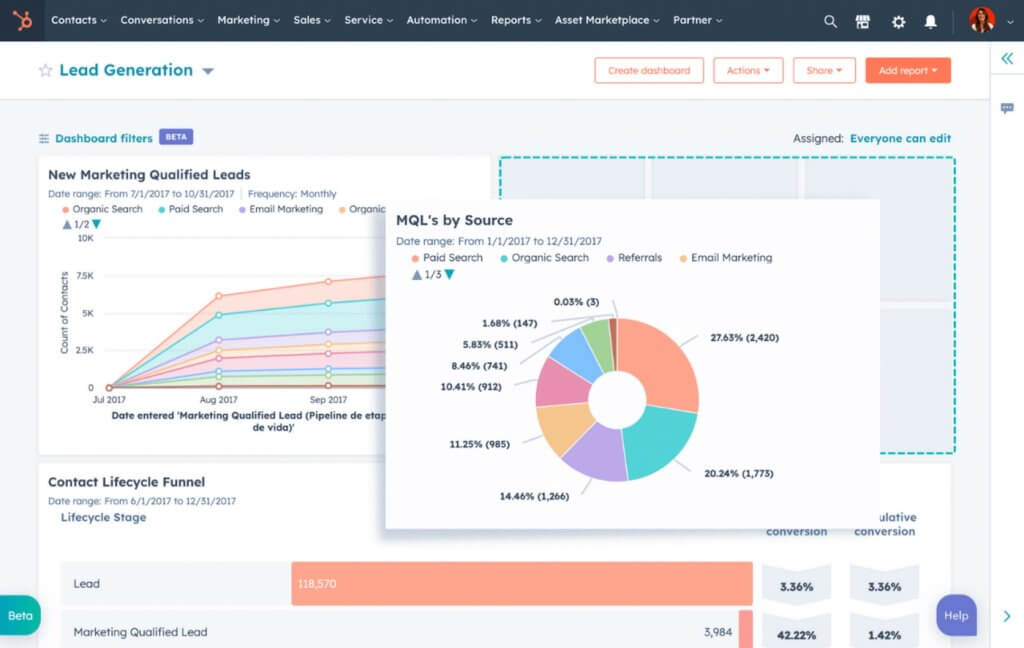
After selecting your report, HubSpot lets you choose where it should live:
Finally, set who can access the report:
Once saved, your dashboards become a single, organized view of the metrics your team needs to review consistently without rebuilding reports from scratch each time.
For a deeper walkthrough on turning your chosen metrics into reports, see our guide to CRM reporting. You’ll learn how to build actionable CRM reports, choose the right data and filters, and pull a few essential reports every sales team should have.
AI has turned CRM metrics from rear-view reports into early warning signals. Instead of discovering a slipping win rate or rising churn after the month closes (and the damage is done), the best AI-powered CRMs can surface patterns sooner. This happens while deals are still negotiable and customers are still salvageable.
The biggest upgrade is fewer spreadsheets and better decisions. In fact, 73% of salespeople using AI-powered CRMs say productivity improved significantly, largely because AI automates manual work and makes insights easier to act on.
This translates to less time updating fields and more time selling. And it’s not just busywork savings because two-thirds of sales and marketing teams using gen AI reported revenue gains, with some seeing increases of more than 10%. That’s why CRM metrics are evolving from “nice to monitor” to “dangerous to ignore.”
Of course, AI isn’t magic. It can flag at-risk deals, predict churn, and surface patterns in customer feedback, but metrics only improve when teams respond. The real winners pair AI insights with clear playbooks, coach when win rates dip, intervene when churn risk rises, and follow up fast when NPS feedback turns sour.
CRM metrics are measurable data points tracked inside a customer relationship management system to evaluate sales performance, customer behavior, and revenue health. Common customer relationship management metrics include close rate, retention rate, churn rate, net promoter score (NPS), and quota attainment.
A strong CRM dashboard includes a small set of metrics that answer key performance questions at a glance:
Dashboards should be simple, focused, and aligned to a specific audience.
Yes. Modern CRM platforms can automatically track most customer relationship management metrics using built-in reports, dashboards, and integrations. Automation reduces manual data entry, improves accuracy, and ensures metrics stay up to date.
The core CRM metrics are similar across B2B and SaaS organizations, but how they’re analyzed can differ. SaaS teams often focus more on recurring revenue, churn, and expansion, while B2B teams may place greater emphasis on close rate, deal size, and sales cycle length.
The most common mistake is tracking too many metrics without clear ownership or action. CRM metrics should drive decisions in coaching, process changes, or customer interventions, and not just populate dashboards.
CRM metrics play a key role in developing a viable sales strategy, identifying positive and negative customer trends, and gauging the overall health of a business. Knowing which metrics to measure and how to track them in CRM software is only the beginning. Eventually, sales teams can harness those metrics to generate CRM sales reports to add to CRM dashboards so they can always be aware of what’s happening and be equipped to make better decisions.

Selling Signals delivers actionable advice for sales and marketing professionals. Learn strategies that help you hit targets, strengthen customer relationships, and win more business. Get expert advice on lead generation, sales processes, CRM software, sales management, and account management directly to your inbox.
Property of TechnologyAdvice. © 2026 TechnologyAdvice. All Rights Reserved
Advertiser Disclosure: Some of the products that appear on this site are from companies from which TechnologyAdvice receives compensation. This compensation may impact how and where products appear on this site including, for example, the order in which they appear. TechnologyAdvice does not include all companies or all types of products available in the marketplace.