-
News & Trends -
Sales -
Marketing Related Topics -
B2B Software Guides Related Topics -
Free Tools & Resources -
- About Us About Us


CRM reporting is the act of taking data from key sales metrics and turning it into an actionable resource using your CRM. It helps businesses and salespeople track goals, identify problems, and create or improve effective strategies. In this article, we’ll explain how CRM reporting works, highlight the five essential report types all CRMs can generate, and even show you how to create your own custom reports.
This article is sponsored by Salesforce, which is known for its advanced reporting features. Throughout the article, you'll find screenshot examples from the CRM to help you visualize key reports and learn to generally create CRM reports yourself. To try the platform and get a feel for building reports in Salesforce, head to their website below for a free 30-day trial:
CRM reporting translates CRM data into actionable insights that track sales CRM metrics over specified time periods using visual features like charts, graphs, trend lines, and more. These elements let you track current data as well as compare them to past time periods or even forecast them into the future. From there, you can aggregate relevant CRM reports into a central CRM dashboard for a snapshot of your key performance indicators (KPIs).
CRM software is capable of running a wide range of standard reports, but it’s best to pull reports that are related to your overall sales goals. If you’re new to CRM reporting, start with commonly-used reports that track the status of your sales pipeline, quality of lead sources, sales team performance, customer satisfaction, and campaign success. Once you’re more acclimated, you can build more customized CRM reporting from there.
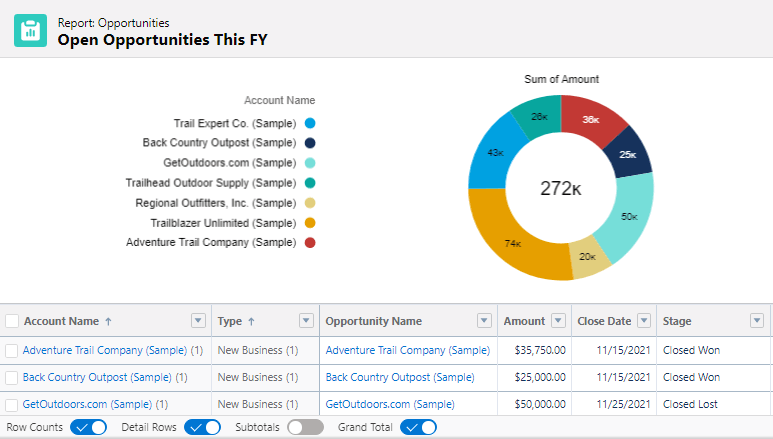
Generating a CRM report is easy if you have the necessary data. Most CRM software offers a selection of standard sales reporting. Just select the CRM report you’d like to run; the software will extrapolate the data and present it in a digestible format, then you can further edit the report to fit your needs.
Alternatively, you can build a custom CRM report if you need to take a deeper dive than what out-the-box options offer. While this may take more effort, it’s a more precise way to extrapolate and present the data you need for accurate reporting. Note that custom report building is often considered a premium feature in most CRMs; this includes Salesforce, the software shown in all screenshots in this article.
CRM reporting spans a wide range of metrics and KPIs, but it’s not tenable for a business to report on every single one. As we noted in our guide to CRM metrics, every business has its own objectives and interpretations of success, so it’s important to limit CRM metrics to those that are in alignment with your organization’s unique needs and goals.
That said, regardless of whether you’re new to CRM reporting or need to revise your current reporting methods, it’s best to stick with the basics and start with at least one of these five common types of CRM reports. You can use these report types as a foundation for more advanced analytics down the line. Here’s a brief rundown of the five common types of CRM reports you can incorporate into your sales strategy:
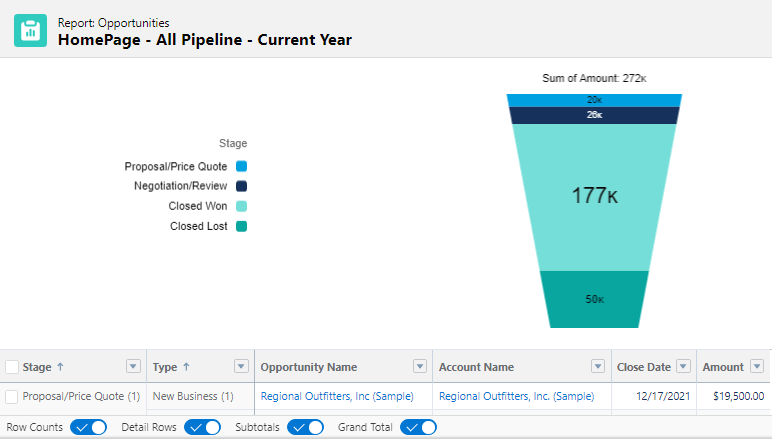
Who Should Track This Report: Salespeople or managers wanting to track an overall pipeline, including information on each deal in the process.
A sales pipeline report is an overview of a pipeline that shows the status of each deal in a lifecycle. It measures the health of a pipeline by showing which deals are set to close and which are in danger of being lost. A sales pipeline report also provides insight into how many deals are currently in a pipeline plus the average size of those deals. In other words, it shows managers if their sales team is adding quality deals that are going to help the business turn a profit.
Here are key metrics to include in a sales pipeline report:
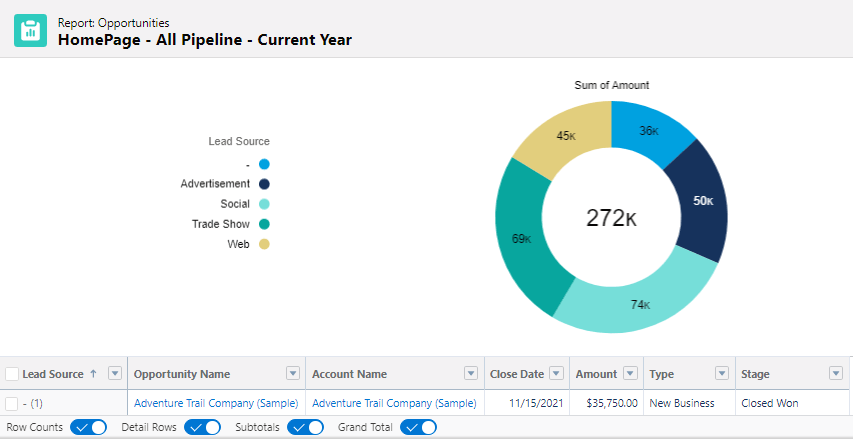
Who Should Track This Report: Sales and marketing leads who want to capitalize on the most successful ways to bring in new customers.
A lead source report presents how and where businesses are capturing new customers. It helps sales and marketing leaders learn which lead sources are bringing in the most qualified leads, conversions, and revenue. A lead source report serves as a valuable blueprint for marketing campaigns since it shows companies where they’re bound to find the most success in generating leads that will ultimately turn into customers.
Here are key metrics to include in a lead source report:
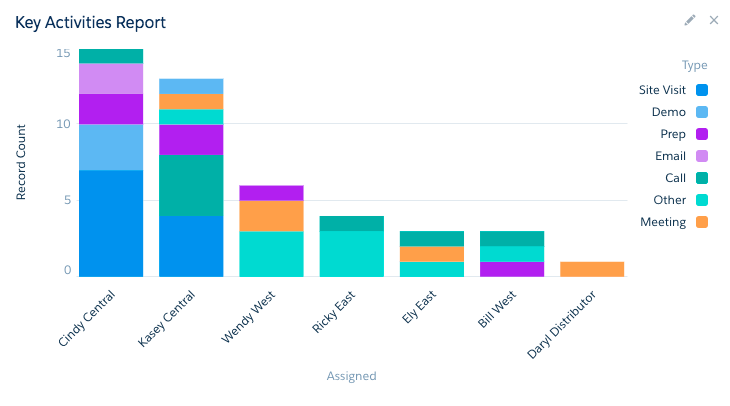
Who Should Track This Report: Sales managers or salespeople wanting to track activity goals like number of phone calls logged.
A sales activity report is a summary of individual actions a sales team has logged over a set period of time. These may include emails sent, calls made, or meetings taken, among other activities. It not only shows which actions sales reps take to connect with contacts, but also the outcomes of those interactions. A sales activity report helps sales managers monitor overall team progress and identify pain points that may be hindering reps from meeting their quotas.
Here are key metrics to include in a sales activity report:

Who Should Track This Report: Customer support teams that want to improve overall customer experience and sales teams that want to increase cross sales through evangelists.
A customer service report is an indicator of how well businesses are meeting the expectations and needs of their clients. It takes into account the variables that prompt customers to either support a company or walk away from it. A customer service report can help support teams provide timely and efficient customer assistance. It can also benefit sales teams that want to leverage evangelists to boost revenue and learn how to convince former clients to return.
Here are key metrics to include in a customer service report:
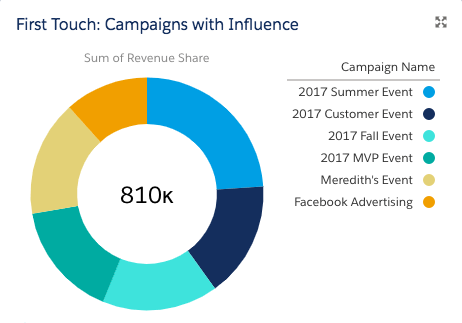
Who Should Track This Report: Sales and marketing teams that want to learn how to craft successful ad campaigns based on historical data.
A campaign performance report is used to measure the effectiveness of past and ongoing marketing campaigns. It provides an overview of how receptive customers are to a company’s message, and shows whether a business is receiving a fair ROI on its advertising efforts. A campaign performance report can help sales and marketing teams create poignant campaigns that lead to a high volume of conversions and steady customer engagement.
Here are key metrics to include in a campaign performance report:
Now that you know the top CRM reports to create and track, let's next discuss how to set up your own CRM reporting. Many CRMs offer similar report setup, but there may be slight differences depending on what you use. To help, we've included examples from Salesforce below, which offers a powerful custom sales reporting tool with easy setup and management.
Setting up CRM reporting is quite simple if you have the data required for the metrics you’d like to measure. We’ve provided a general breakdown of how to create a report using Salesforce as an example. Of course, the exact process will vary among platforms, so you can refer to this as a general guide that will be applicable to most mainstream CRM options.
Alternatively, you can opt to use an out-of-box CRM reporting template if a baseline report will suit your needs. These bespoke reports have filters and allow for some basic customization. For deep data dives, it’s best to create your own report using the steps below: create a new report, select properties based on the metric you want to track, then build, run, design, and share the report. We'll provide additional details on each step below.
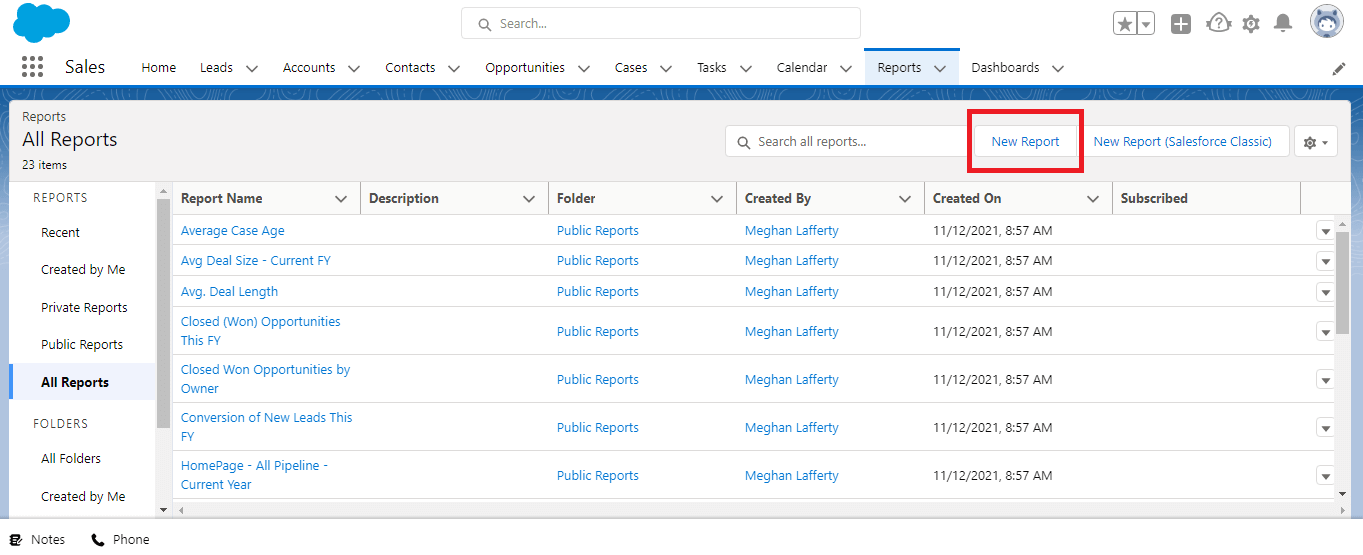
Start by going to your CRM’s reports list page and then choosing to create a new report; in Salesforce, for example, there's a New Report button at the top of the page.
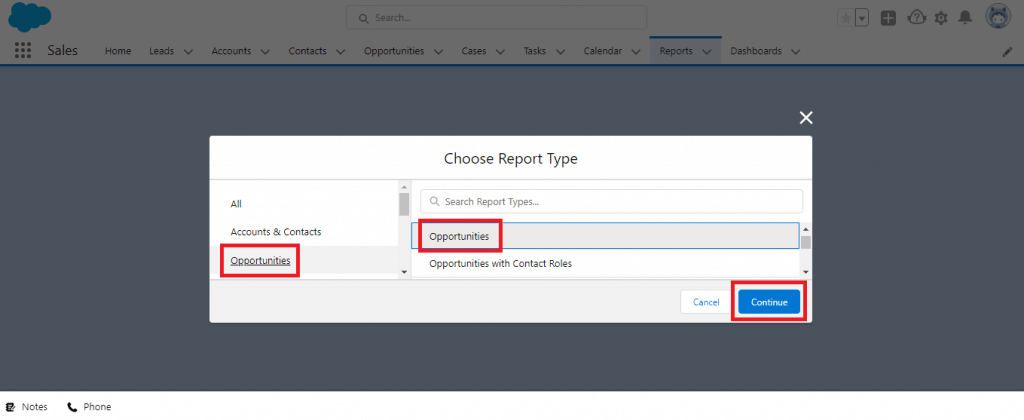
Choose the main properties of the metric you're trying to view. In Salesforce, you can select the main category based on the CRM metric you want to track, then you can keep the report type general or get more specific. In this example, we’ve chosen "opportunities" as the type and subtype so we can work with the broad related details in the report.
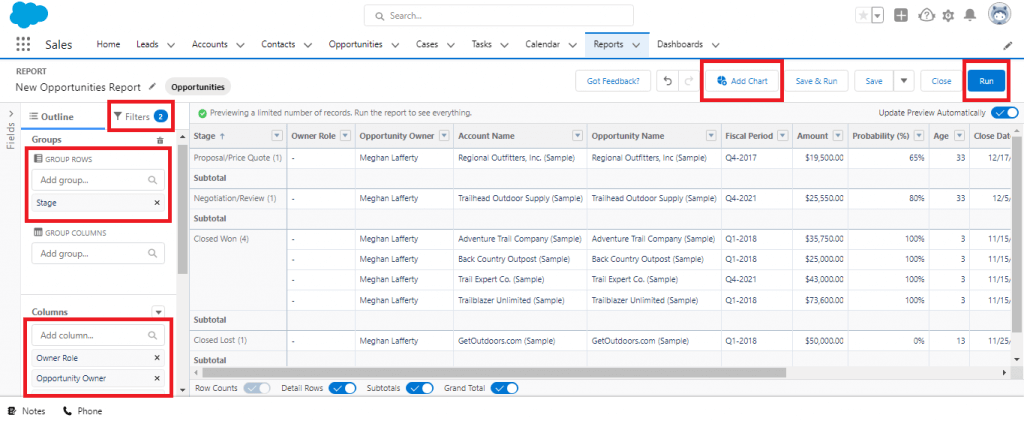
When it's time to officially create and run the report, your CRM should prompt you to modify the report details and then run it to ensure that it shows exactly what you want.
If you're using Salesforce, you'll see a table of the information related to the type you chose (in this case, opportunities) on the report preview page. You can now use the Group Rows function to have the report show the specific metric you'd like. In this example, using "stage" to group the rows will show the amount of prospects and customers in each stage of your pipeline. Then, you can use the Columns and Filters functions to add, remove, and specify report data.
Your CRM will likely give you the option to add a visual chart to your report, such as the Add Chart button below. You'll then run the report and continue to the next page, where you should be able to design and further manipulate the report as needed.
Many CRMs will allow you to view the report you've run as both a table and a visual chart, where you can edit the report until it looks the way you'd like before saving it. If you're using Salesforce, you'll see the same table from the previous page with a visual chart above it. You can now remove data, change the format of the chart by clicking the gear icon, and save it when you're ready so it will continue presenting your metrics in real time.
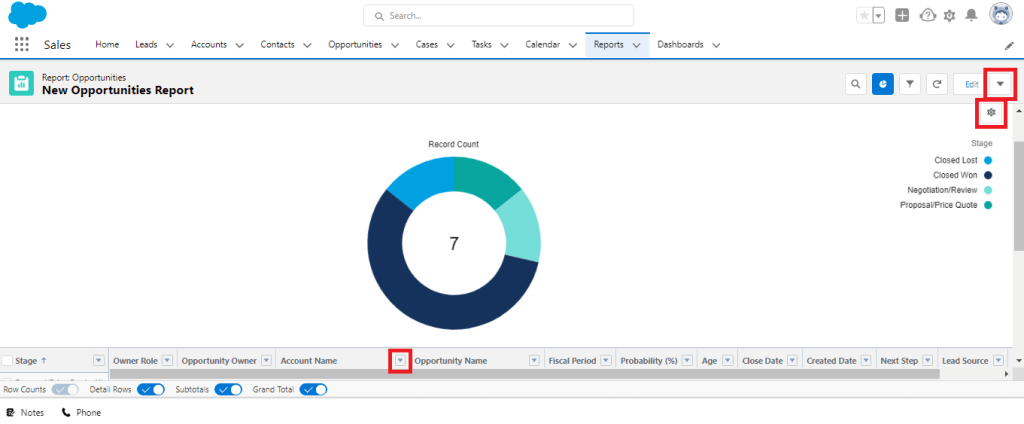
Once you’ve finished putting your CRM report together, download it to share with other key decision makers in your organization, either via email or as a printout. This will render a static report that can be used in deeper analyses of ongoing sales trends. A better way to share your report is by saving it right to your dashboard, where it will continue presenting up-to-date activity.
To use a dashboard, first head back to your CRM's reports page and find the new report you created. See whether the report is listed as private or public, and change the viewing permissions if you'd like you alone, your team, or your organization to access it. To do this in Salesforce, click the dropdown next to your report, and choose Move to add it to either a public or a private folder.
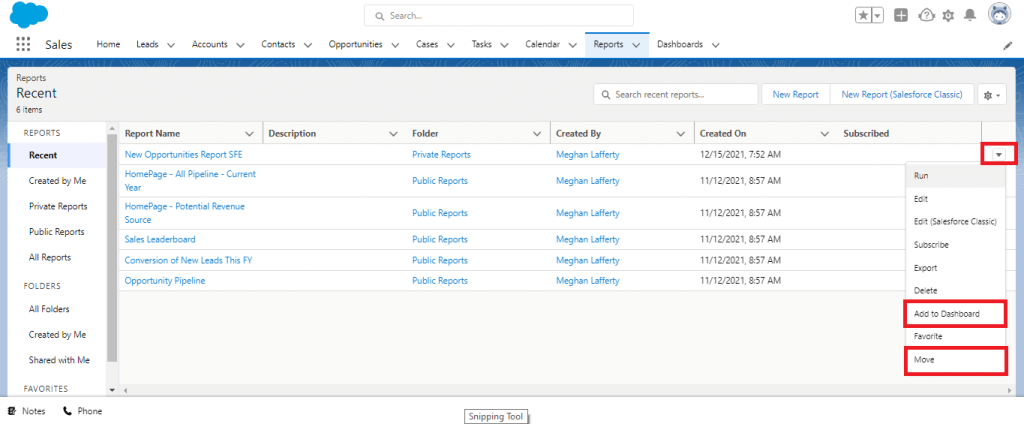
When the correct people have access to the report, add it to your CRM dashboard, where your software may prompt you to choose an existing dashboard or create a new one. Unlike a CRM report, a CRM dashboard is more straightforward in presenting data since it’s meant to be viewed at a glance. We delve more into that in our guide to CRM dashboards, where we teach you how to create a dashboard like the one below:
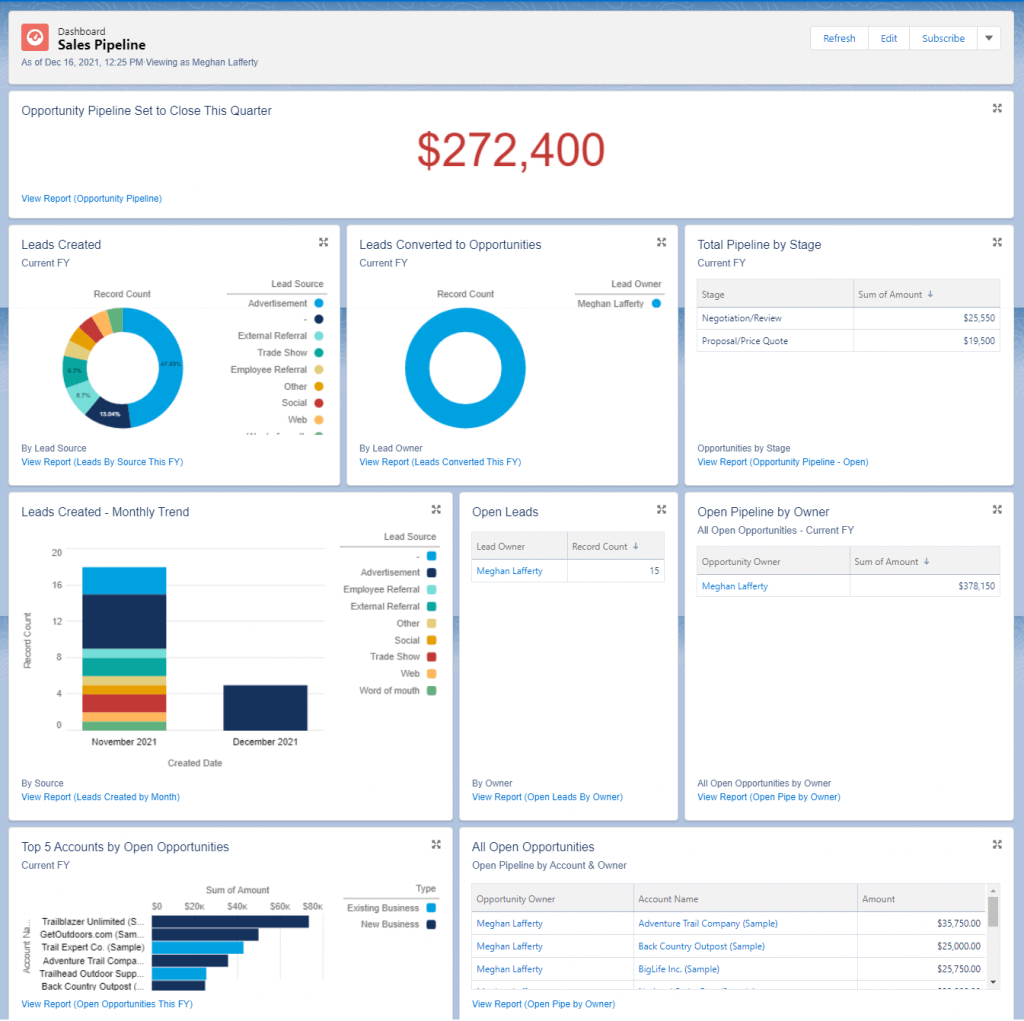
CRM software is a sales tool, but the value of CRM reporting is not limited to sales teams, nor should it be. CRM reporting provides a holistic view of how a business is performing. Thus, it’s important for various departments across an organization to have access to these reports so they can make decisions that will ultimately benefit their team and the business at large.
Here’s who should use CRM reporting, along with the most common use cases:
If you use a CRM, chances are you'll benefit from learning how to create reports using the data and activities you log within the software.
CRM reporting is a welcome alternative to sifting through spreadsheets. Fortunately, CRM software makes it easy to extrapolate data and turn it into an accessible resource. Learn how to harness your CRM’s reporting capabilities, and your business will reap the benefits of having actionable insights you can reference when making key sales decisions.
For a great CRM with advanced reporting, check out Salesforce CRM:


Alison is a Philadelphia-based technology writer for Selling Signals. She has 15 years of experience in the digital space, and her specialties include comparison guides and reviews across CRM, ecommerce, and various SaaS products. In her free time, Alison has received two HubSpot certifications plus a TEFL certification, as well as leads an online martial arts learning program.

Selling Signals delivers actionable advice for sales and marketing professionals. Learn strategies that help you hit targets, strengthen customer relationships, and win more business. Get expert advice on lead generation, sales processes, CRM software, sales management, and account management directly to your inbox.
Property of TechnologyAdvice. © 2026 TechnologyAdvice. All Rights Reserved
Advertiser Disclosure: Some of the products that appear on this site are from companies from which TechnologyAdvice receives compensation. This compensation may impact how and where products appear on this site including, for example, the order in which they appear. TechnologyAdvice does not include all companies or all types of products available in the marketplace.