


A CRM dashboard is your command center for turning CRM data into decisions. It brings your most important metrics — pipeline health, activity, conversions, and forecast performance — into one place, with the ability to drill down into deeper reporting when you need context.
Today, dashboard CRM tools aren’t just static scorecards. The best dashboards have evolved from periodic reporting to real-time insight. They’ve also moved from manual tracking to AI-assisted analysis that highlights what’s changed, what’s at risk, and what to do next.
Depending on your CRM, this can include AI-powered forecasts, automated insights and alerts, and predictive deal scoring to help teams prioritize the right opportunities faster.
This guide isn’t here to redefine what a CRM dashboard is because you already know the basics. It’s built to help sales leaders and revenue teams use dashboards strategically: what to track, how to design views that drive action, and how to set up dashboards that support faster, smarter decisions.
- The most important dashboard CRM metrics (by role)
- CRM dashboard samples that actually drive revenue
- How AI is changing dashboard CRMs (without replacing humans)
- How to choose a CRM dashboard that fits your sales team
- Best practices for designing high-impact CRM dashboards
- Frequently asked questions (FAQs)
- Bottom line
The most important dashboard CRM metrics (by role)
The most effective CRM dashboards are built around who’s using them. Sales reps, managers, and revenue leaders need different views to make fast, confident decisions. These are the metrics that matter most by role, and what they’re actually used for.
These metrics help reps prioritize the right deals and execute the next best step quickly. They keep daily work focused on momentum and deal health, while reducing guesswork with AI signals. Use them to plan your day, spot stalled opportunities, escalate risks early, and double down on deals most likely to close.
- Open deals by stage: A live view of current opportunities grouped by where they sit in the pipeline.
- Next activity due: The next scheduled touchpoint per account or deal, so follow-ups don’t slip.
- Deal value and close date: Expected revenue and timing to prioritize high-impact, time-sensitive deals.
- Time in stage: How long each deal has been stuck at a given step to identify stall risk.
- Win rate by stage: The likelihood of progressing or closing based on past outcomes at each stage.
- AI deal priority score: A predictive score that ranks deals by likelihood to close or urgency based on signals (engagement, history, activity, fit).
These metrics support coaching, forecasting, and pipeline risk management. They reveal whether the team is on track, where deals are getting stuck, and which reps or opportunities need attention. Use them to diagnose performance issues by stage, intervene earlier on at-risk revenue, and improve forecast reliability over time.
- Pipeline value vs quota: Current pipeline compared to the target to see if coverage is sufficient.
- Forecasted revenue: Expected bookings based on close dates, stages, and projected probabilities.
- Stage-to-stage conversion rates: The percentage of deals moving forward at each stage to pinpoint bottlenecks.
- Win rate by rep: Close performance by individual to identify coaching needs and repeatable strengths.
- Average deal size: Typical contract value to understand whether the team is building enough pipeline quality.
- AI forecast confidence/risk alerts: AI-driven signals that flag deals likely to slip or forecasts that may be overestimated.
These metrics focus on predictability, efficiency, and scalable growth. They connect sales execution to business outcomes and expose friction across marketing, sales, and retention.
Use them to guide planning and investment decisions, improve revenue predictability, and align teams around the highest-leverage levers.
- Forecast accuracy: How close predictions are to actual results to evaluate process and reliability.
- Revenue growth rate: Change in revenue over time to track progress toward growth goals.
- Pipeline coverage ratio: Pipeline value relative to goal (often a multiple) to assess if targets are achievable.
- Customer acquisition cost (CAC): Total cost to acquire customers to measure efficiency and unit economics.
- Lead-to-opportunity conversion rate: How effectively leads become qualified pipeline, indicating lead quality and handoff health.
- AI revenue insights/trend predictions: Automated pattern detection that highlights emerging risks, leading indicators, or likely performance shifts before they show up in lagging metrics.
CRM dashboard samples that actually drive revenue
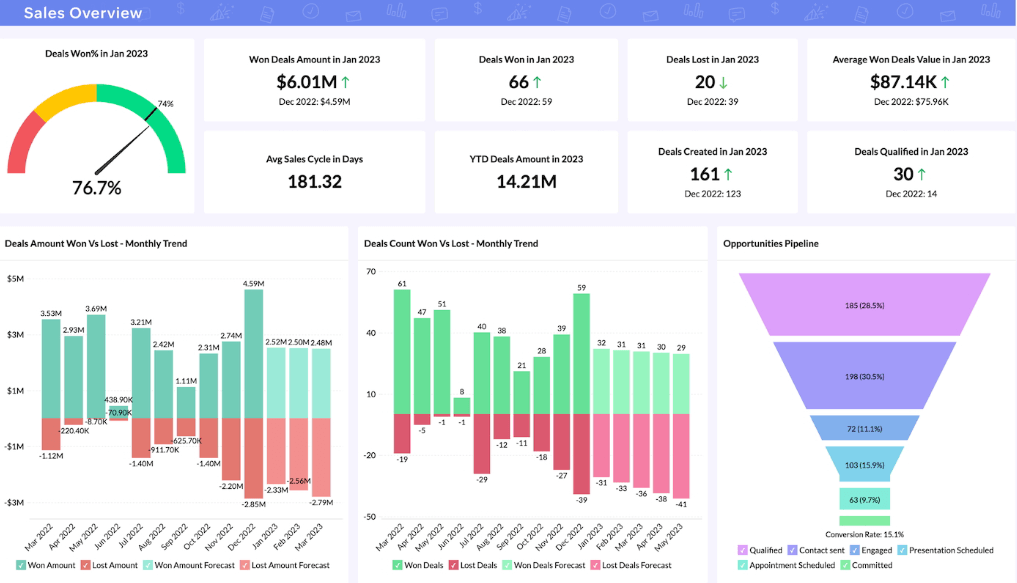
High-performing CRM dashboards don’t just show data; they surface signals that prompt action. The sample CRM dashboards below highlight the most common revenue-driving dashboard types, what they’re designed to reveal, and how sales teams use them to influence outcomes. These are also the dashboards buyers should look for when evaluating CRM tools.
When CRM dashboards are designed around revenue-driving decisions, teams spend less time reporting and more time acting. The best platforms make it easy to customize these views, update them in real time, and enhance them with AI, so insights turn into outcomes.
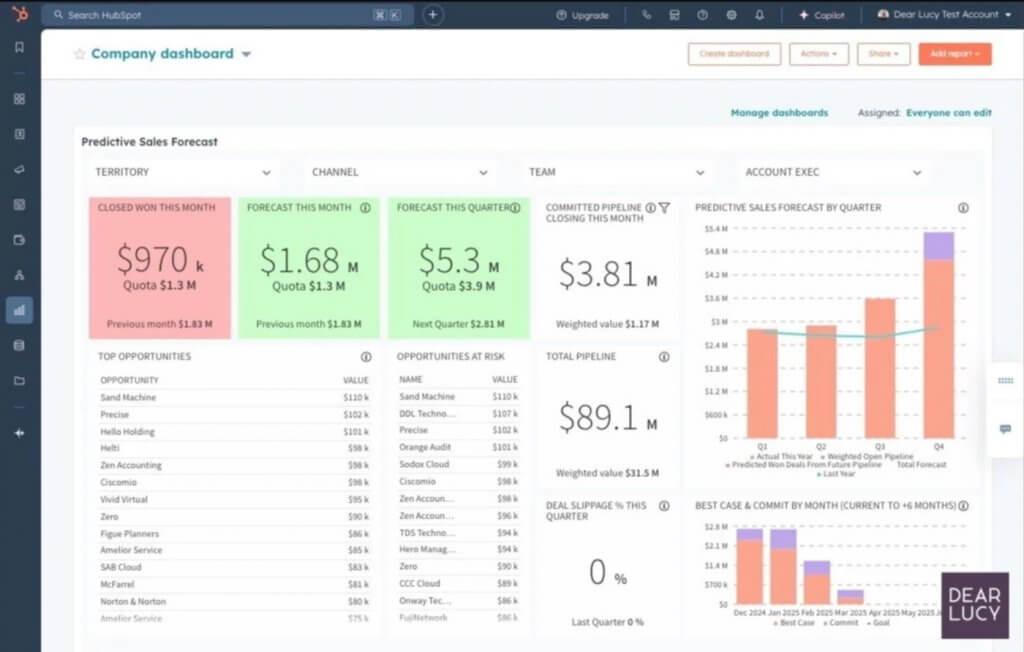
Pipeline and forecast dashboard
What it shows:
- Open pipeline value by stage
- Forecasted revenue vs target
- Deal close dates and slippage
- AI-powered forecast confidence or risk indicators
Why it drives revenue:
Pipeline and forecast dashboards help teams identify gaps early and reduce end-of-quarter surprises. When forecasts update in real time and include AI-driven risk signals, leaders can course-correct sooner and focus on deals that need attention now.
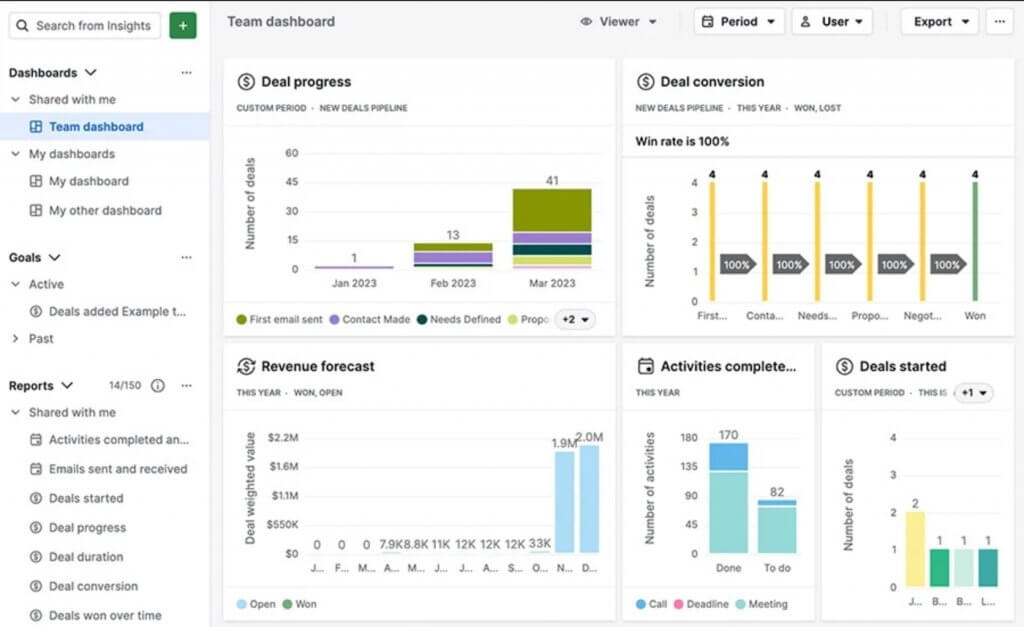
Sales activity and performance dashboard
What it shows:
- Calls, emails, and meetings by rep
- Activity trends over time
- Win rates and conversion performance
- AI insights into engagement patterns
Why it drives revenue:
Activity dashboards connect effort to outcomes. They help managers reinforce behaviors that lead to wins and catch performance dips before they impact revenue.
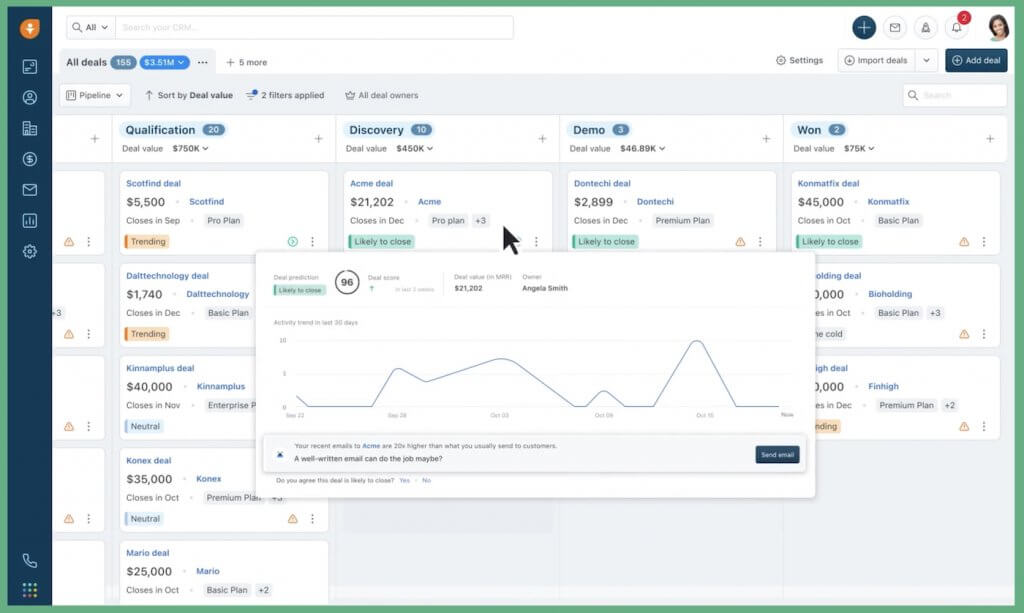
Deal health dashboard
What it shows:
- Time in stage
- Recent activity and engagement
- Deal size vs historical benchmarks
- AI-generated deal risk or priority scores
Why it drives revenue:
Deal health dashboards surface stalled or at-risk opportunities before they’re lost. AI-powered signals help reps and managers focus on deals that need intervention, and exit low-probability deals faster.
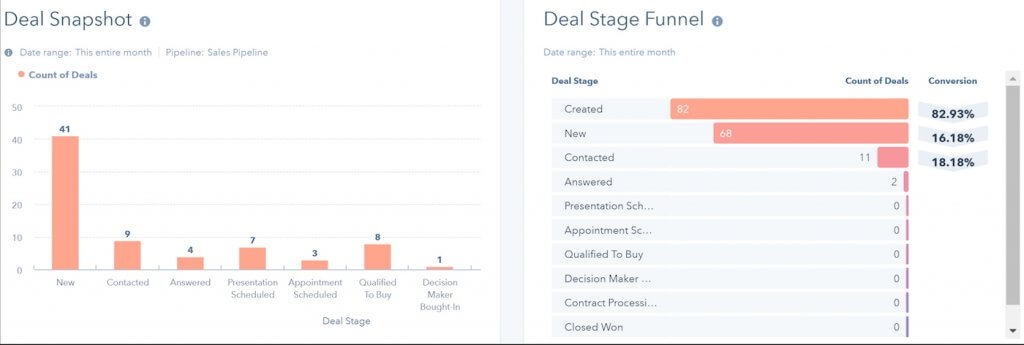
Conversion and funnel dashboard
What it shows:
- Lead-to-opportunity conversion rates
- Stage-to-stage drop-off
- Average deal velocity
- AI insights into funnel bottlenecks
Why it drives revenue:
Funnel dashboards reveal exactly where revenue leaks occur. Even small improvements in conversion rates or velocity can compound into meaningful growth.
Executive revenue dashboard
What it shows:
- Revenue growth trends
- Forecast accuracy
- Pipeline coverage ratio
- AI-driven revenue predictions and alerts
Why it drives revenue:
Executive dashboards focus on predictability and trajectory. They give leadership teams confidence in the numbers and clarity on where to invest, hire, or adjust strategy.
How AI is changing dashboard CRMs (without replacing humans)
AI is turning CRM dashboards from static scorecards into decision-support tools. Instead of only summarizing what happened, modern dashboards can surface patterns, flag risk, and suggest next steps so teams act sooner with a better signal.
And the shift is already tied to outcomes: 83% of sales teams using AI reported revenue growth this year, compared with 66% of teams without AI.
What AI-enabled dashboards do better
Surface changes in real time
AI helps spot early warning signs (slipping close dates, stalled stages, or deals going quiet) without managers having to dig through reports.
Improve forecasting with confidence signals
AI can estimate likelihood-to-close using engagement, velocity, and historical patterns, then layer in risk indicators to help teams challenge and refine the forecast. Adoption is growing here specifically, with more than a third of respondents saying they’re using AI tools for forecasting, lead scoring, and pipeline analysis.
Prioritize deals with predictive scoring
AI deal scoring helps reps and managers focus on opportunities most likely to close (or most likely to slip). The best dashboards not only show a score but point to the drivers behind it, like inactivity, long times in stages, or low engagement.
Automate insights and alerts
Dashboards increasingly act like notification hubs, surfacing changes that matter (pipeline coverage dips, a large deal stalls, or activity drops) so teams can respond fast.
Suggest next best actions
Some CRMs recommend follow-ups and next steps based on what’s worked in similar deals. These are most useful when they’re specific and contextual, not generic reminders.
Where humans still matter
AI can surface signals, but humans still own the call. The best teams use AI for detection and prioritization, then rely on people for decisions that require nuance — deal dynamics, relationship context, competitive pressure, and the “why” behind behavior.
Use AI scores as prompts, not truth. Choose dashboards that clearly explain why something is flagged, and keep CRM hygiene strong, since AI is only as reliable as the data feeding it.
How to choose a CRM dashboard that fits your sales team
Not every dashboard CRM tool works the same way or works for every team. The right choice depends on how your sales organization operates today, where it’s growing next, and how much support you want from automation and AI.
Use the criteria below to evaluate whether a sales CRM dashboard will actually support your team’s goals or just add more reporting noise.
1. Match dashboards to sales roles
A strong CRM should support role-based dashboards out of the box. Sales reps need views that prioritize next actions and deal momentum.
Managers need visibility into pipeline health, conversions, and forecast risk. Leadership needs high-level revenue trends and predictability. If everyone is looking at the same dashboard, it’s probably not serving anyone well.
2. Prioritize action over volume
More charts don’t equal better insight. Look for dashboards that highlight what needs attention now, not every available metric. The best dashboards surface exceptions, risks, and changes (stalled deals, slipping forecasts, or activity drop-offs) so teams know where to act without digging.
3. Evaluate AI and automation carefully
AI can add real value, but only if it’s transparent and usable. Look for CRM dashboards that:
- Explain why a deal is flagged or scored a certain way.
- Offer practical insights like forecast confidence or deal risk.
- Support alerts and recommendations without overwhelming users.
Avoid tools that treat AI as a black box or bury insights behind extra clicks.
4. Check customization and flexibility
Every sales process is different. Your CRM dashboard should be easy to customize by pipeline, region, deal size, or team structure without heavy admin work. If simple changes require custom reports or technical help, adoption will suffer.
5. Consider ease of use and adoption
A powerful dashboard doesn’t help if your team won’t use it. Look for clean layouts, intuitive navigation, and dashboards that update automatically based on CRM activity. The faster someone can understand what they’re looking at, the more likely the dashboard becomes part of their daily workflow.
6. Make sure it scales with your team
What works for a five-person sales team may not work at 50. Choose dashboards that can grow with you — adding AI insights, advanced CRM reporting, or executive views as your sales motion becomes more complex.
The best CRM dashboard fits the way your team actually sells. It supports each role, surfaces actionable insights, and evolves as your process matures. Dashboards that align with real workflows become a competitive advantage for your team instead of just another tool to maintain.
Best practices for designing high-impact CRM dashboards
A high-impact CRM dashboard isn’t about showing more data; it’s about showing the right data, in the right way, at the right time. These best practices will help ensure your dashboards drive action, not just awareness.
1. Design dashboards around decisions.
Start with the decision the dashboard should support. It could be prioritizing deals, coaching reps, adjusting forecasts, or reallocating resources. If a metric doesn’t influence action, it doesn’t belong on the dashboard.
2. Limit metrics to what matters most.
More metrics create noise. The most effective dashboards focus on five to seven core metrics per view, making it easier to spot change without analysis paralysis.
3. Build dashboards by role.
Sales reps, managers, and leaders need different views. Role-based dashboards improve relevance, adoption, and speed by aligning insights to daily responsibilities.
4. Use visual hierarchy to guide attention.
Not all data is equal. Place the most critical metrics at the top, group related metrics together, and use size and layout to direct focus where it matters most.
5. Highlight change and risk, not just totals.
Dashboards should show what’s new, slipping, or at risk (stalled deals, stage bottlenecks, or AI-flagged opportunities) so teams know where to act immediately.
6. Make AI insights clear and explainable.
If AI is involved, transparency matters. Dashboards should explain why a deal is flagged or a forecast shifts to build trust and drive confident action.
7. Keep dashboards current and easy to use.
Dashboards should update automatically and be easy to scan at a glance. If they’re slow, cluttered, or outdated, teams won’t rely on them.
High-impact CRM dashboards are intentional by design. When they focus on decisions, highlight change, and make insights easy to act on, dashboards become tools your team relies on, not reports they check once and forget.
Frequently asked questions (FAQs)
A CRM dashboard should include the metrics that support decisions for a specific role. For most teams, that means pipeline value, forecasted revenue, deal progress by stage, activity levels, and conversion rates. The best dashboards focus on a small set of actionable metrics rather than every available data point.
AI-powered dashboards can be worth it when they surface clear, explainable insights, such as deal risk, forecast confidence, or next best actions. Teams see the most value when AI supports prioritization and early detection, not when it replaces human judgment.
Yes. Dashboards that combine real-time pipeline data with AI-assisted forecasting help teams identify risk earlier, adjust assumptions, and reduce end-of-quarter surprises. Forecast accuracy improves most when dashboards are reviewed consistently and tied to clear follow-up actions.
Yes. Even small teams benefit from dashboards that show deal progress, upcoming activities, and pipeline health in one place. The key is simplicity. Small teams should avoid over-customization and focus on the few metrics that directly impact revenue.
CRM dashboards should update automatically as activity happens. Teams should review dashboards daily or weekly, depending on role, and revisit dashboard design quarterly to ensure metrics still align with current goals.
Dashboards provide a real-time, visual snapshot of key metrics designed for ongoing use. Reports are typically more detailed, static, and used for deeper analysis or one-time reviews. Dashboards help teams act; reports help teams analyze.
Bottom line
Dashboard CRM tools are most effective when they’re designed for how your team actually sells. The best dashboards surface the right metrics for each role, highlight change and risk in real time, and use AI to prioritize what needs attention, all without removing human judgment from the process.
When dashboards are built around decisions instead of data volume, they become a daily tool for driving pipeline health, forecast confidence, and revenue growth, not just another report that gets checked and ignored.